A part of the project: Marine Analytics using Computer Vision
3D-ZeF: A 3D Zebrafish Tracking Benchmark Dataset
Malte Pedersen*, Joakim Bruslund Haurum*, Stefan Hein Bengtson, Thomas B. Moeslund
CVPR 2020
Introduction
This is the project page for 3D-ZeF, the first RGB 3D multiple object tracking dataset of its kind. Zebrafish is a widely used model organism for studying neurological disorders, social anxiety, and more. Behavioral analysis can be a critical part of such research and it has traditionally been conducted manually, which is an expensive, time consuming, and subjective task.
With the publication of 3D-ZeF, we hope that we can spark the interest in the field such that solutions to this extremely difficult multiple object tracking problem can be developed.
 Setup
Setup
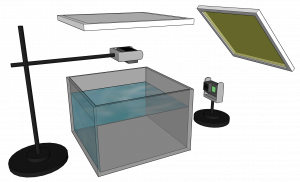
We have used an off-the-shelf setup for capturing the dataset, which consists of two GoPro cameras, a glass aquarium, and two IKEA light panels. We have used this relatively cheap setup on purpose in order to hopefully make automated 3D behavioral analysis of zebrafish more accessible to smaller labs, students, and the likes.
Dataset
The dataset consists of a training, validation, and test split. Each split consists of multiple sequences and each sequence consists of two recordings. It should be noted that unique fish are used in each split. Furthermore, the fish in the training and validation split are from one cohort of fish and the zebrafish in the test split are from a completely different and younger cohort. This is to avoid data leakage and overfitting.
 Each sequence consists of two recordings, one from each of the two GoPros. The details of the dataset are presented in the table below where the name of each dataset denotes what split it belongs to and the amount of fish present. E.g., Trn2 belongs to the train split and it has two fish present.
All the fish have been manually bounding and point annotated in all frames. The point annotations are placed on the head of the fish in order to have a stable point for the stereo 3D reconstruction phase. In cases where a fish head is occluded we have estimated the head point annotations as best as possible and only the visible part of the fish has been bounding box annotated. In cases where the fish is totally occluded the bounding box will only be an estimated point.
The dataset is published as a 3D MOT challenge on https://motchallenge.net/data/3D-ZeF20 along with ground truth labels and calibration files.
| Trn2 | Trn5 | Val2 | Val5 | Tst1 | Tst2 | Tst5 | Tst10 | Total | |
|---|---|---|---|---|---|---|---|---|---|
| Length | 120 s | 15 s | 30 s | 15 s | 15 s | 15 s | 15 s | 15 s | 240 s |
| Frames | 14,400 | 1,800 | 3,600 | 1,800 | 1,800 | 1,800 | 1,800 | 1,800 | 28,800 |
| BBs | 28,800 | 9,000 | 7,200 | 9,000 | 1,800 | 3,600 | 9,000 | 18,000 | 86,400 |
| Points | 28,800 | 9,000 | 7,200 | 9,000 | 1,800 | 3,600 | 9,000 | 18,000 | 86,400 |
Complexity Measure
We also present a complexity measure that is used to compare the sequences. In almost all multiple object tracking (MOT) challenges, the biggest problem is occlusion. Therefore, our complexity measure, Ψ, is based on occlusions and it shows that it is not necessarily the amount of fish that determines how difficult a given MOT problem is, but rather the movement of the objects. The measure is based on: occlusion count (OC), occlusion length (OL), time between occlusions (TBO), and intersection between occlusions (IBO). You can read more about how we calculate all the measure in the paper.
| Trn2 | Trn5 | Val2 | Val5 | Tst1 | Tst2 | Tst5 | Tst10 | |
|---|---|---|---|---|---|---|---|---|
| Ψ | 0.26 | 0.50 | 0.03 | 0.63 | 0.00 | 0.01 | 0.16 | 0.28 |
 Results
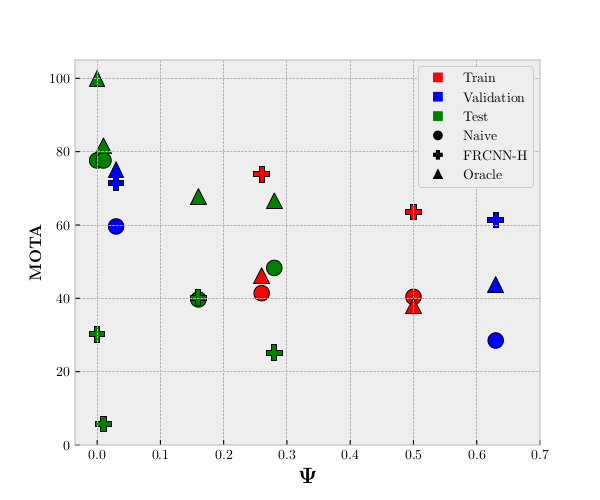
In the figure to the right you see our MOTA results compared to the complexity measure, Ψ, described in the previous section. The red, blue, and green colors represent the train, validation, and test split, respectively. The circle, cross, and triangle represent the results of our tracker system with a naive detector, a Faster R-CNN based head detector, and an oracle tracker, respectively. You can read more about the three methods in our paper and in the supplementary material.
One of the things to notice in the results is the correlation between the complexity measure and the MOTA results of the naive and oracle trackers. As the complexity rises the MOTA results naturally go down.
However, this is not the case for the FRCNN-H. If you look at the crosses you can see that for the train and validation split (red and blue) the results are really good even though the sequences are complex. But moving on to the test split (green) the FRCNN-H tracker does not perform very well, which is most likely because the fish of the test split are from a completely new cohort of fish. This indicates that even though the fish may look alike to humans, there is a great chance for overfitting standard CNNs to specific cohorts of fish. We find this especially interesting as it has not previously been addressed within the zebrafish tracking field.
Citation
@InProceedings{Pedersen_2020_CVPR,
author = {Pedersen, Malte and Haurum, Joakim Bruslund and Bengtson, Stefan Hein and Moeslund, Thomas B.},
title = {3D-ZeF: A 3D Zebrafish Tracking Benchmark Dataset},
booktitle = {IEEE/CVF Conference on Computer Vision and Pattern Recognition (CVPR)},
month = {June},
year = {2020}
}